# Fun Company Progress Chart (with Zooming / Panning)
**URL:** https://community.omni.co/t/fun-company-progress-chart-with-zooming-panning/321
**Category:** Visualizations
**Created:** [May 6, 2025, 8:59pm UTC](https://community.omni.co/t/fun-company-progress-chart-with-zooming-panning/321 "2025-05-06T20:59:12Z")
**Posts on this page:** 2
**Page:** 1
### Author:  [@colin](https://community.omni.co/u/colin)
#### Post date: [May 6, 2025, 8:59pm UTC](https://community.omni.co/t/fun-company-progress-chart-with-zooming-panning/321/1 "2025-05-06T20:59:12Z")
To celebrate our growth, we built a little visualization highlighting all of the Omnis alongside our customer growth (demo [here](https://www.youtube.com/watch?v=lH-Wjv7iNy8))
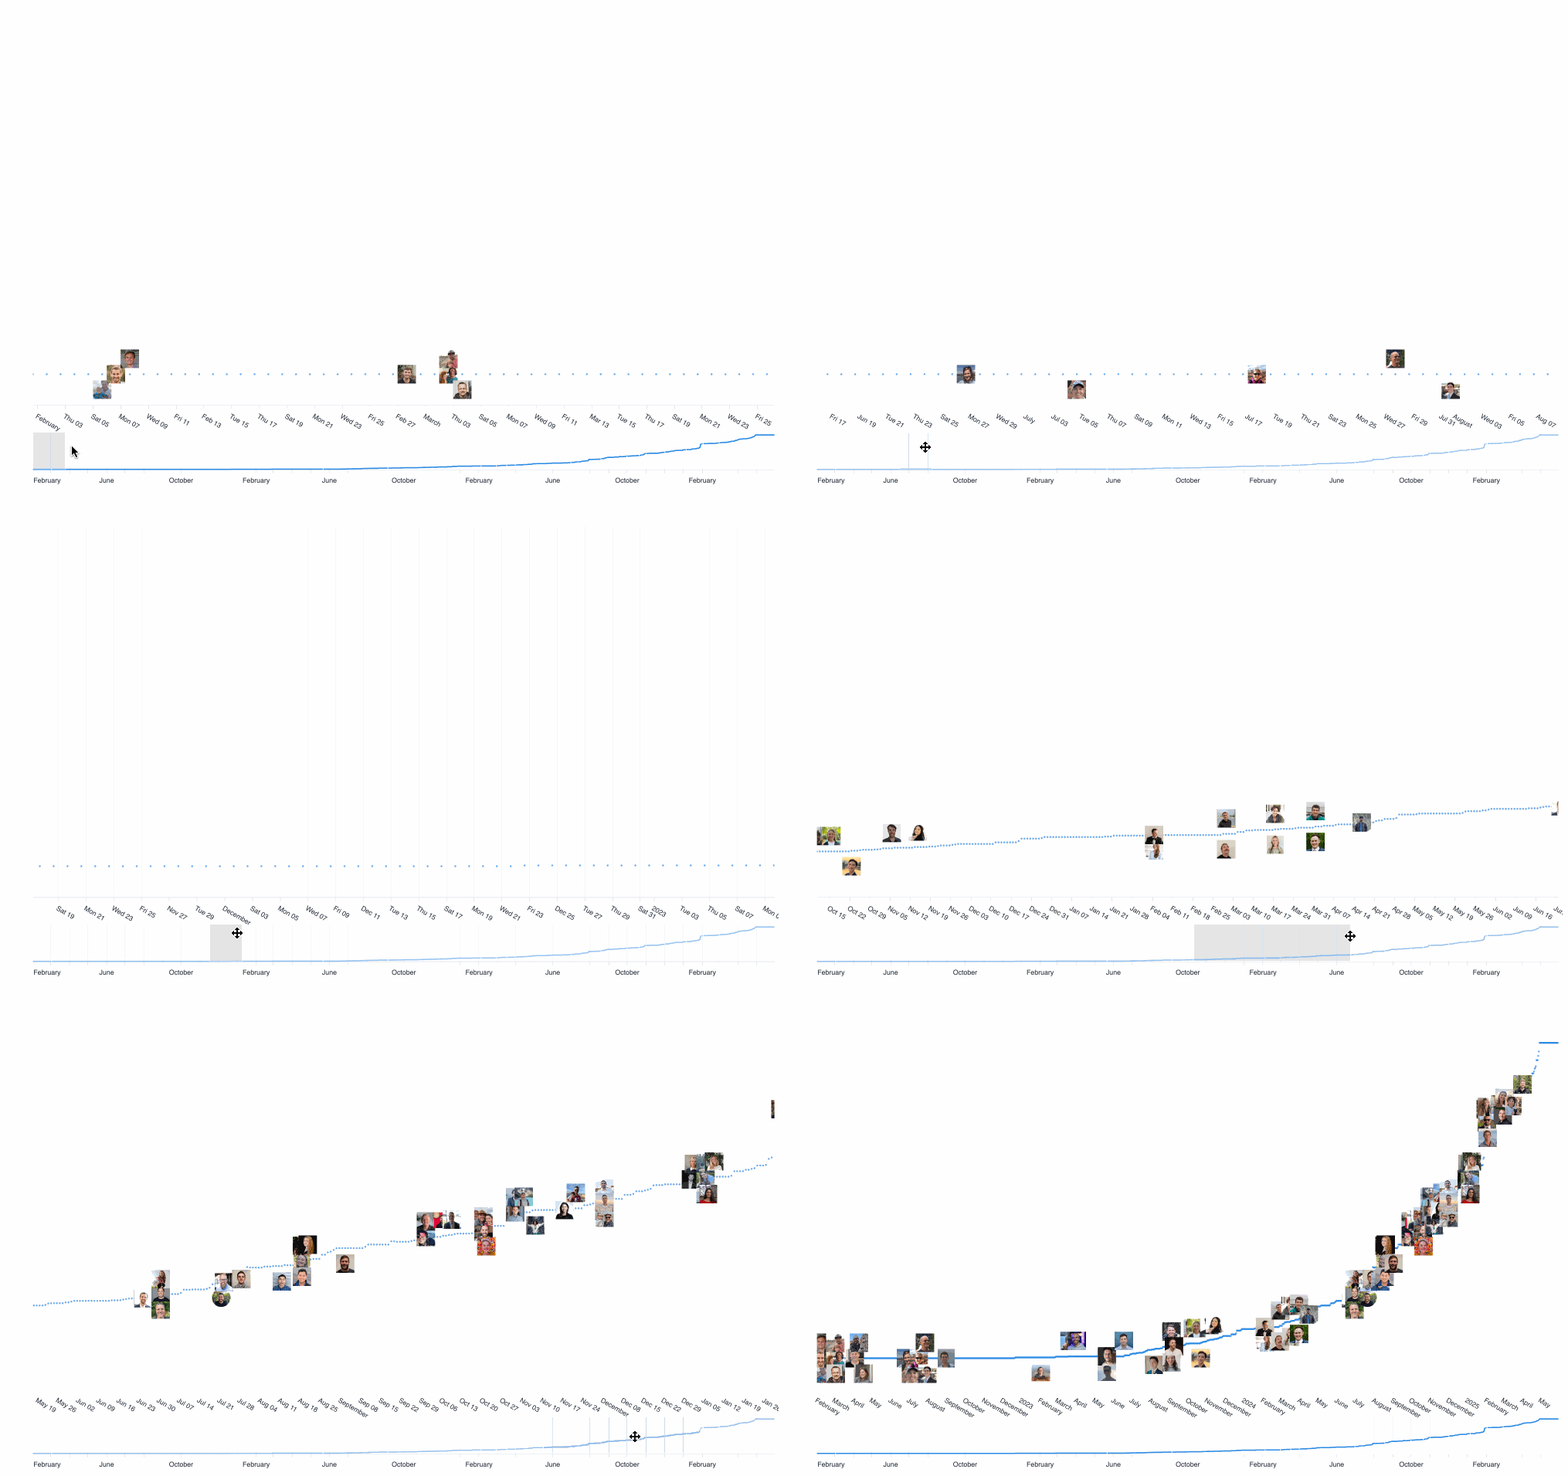
Here’s a code example for folks that want to build something similar.
We used a csv upload to grab employee images from our website (not names and the photo URLs):

To build the query we built a table of daily ARR joined to employee start dates:

Because we did have some share start dates, we need a few calcs to munge the result sets - jittering photos so they are visible, bit of url munging for the photos to remove nulls, and removing duplicate date entries and ARR entries (see below):

Here’s are the calcs we used in case you are attempting something similar:
Null removing (`calc_11`): `= IF(I1 = "", "", I1)`
Photo jitter (`calc_12`): `= MAX(F3:F9) + (MOD(ROW(), 3) * 500000) - 500000`
Blanking repeat date entries (`calc_7`): `= IF(A32 = A31, "", SUM(D$1:D32) + SUM(E$1:E32))`
And finally here is the Vega Lite code:
```auto
{
"vconcat": [
{
"layer": [
{
"mark": {
"size": 10,
"type": "circle"
},
"encoding": {
"x": {
"axis": {
"labelAngle": 30
},
"sort": "ascending",
"type": "temporal",
"field": "dates\\.date\\[date\\]",
"scale": {
"domain": {
"param": "brush"
}
},
"title": null
},
"y": {
"axis": {
"title": "Running iARR",
"format": "USDCURRENCY_0",
"orient": "left",
"formatType": "omniNumberFormat",
"labelOverlap": true
},
"type": "quantitative",
"field": "calc_7",
"title": [
"Running iARR"
]
}
}
},
{
"mark": {
"type": "image",
"width": 30,
"height": 30
},
"encoding": {
"x": {
"sort": "ascending",
"type": "temporal",
"field": "dates\\.date\\[date\\]",
"scale": {
"domain": {
"param": "brush"
}
},
"title": null
},
"y": {
"axis": {
"title": "Running iARR",
"format": "USDCURRENCY_0",
"orient": "left",
"formatType": "omniNumberFormat",
"labelOverlap": true
},
"type": "quantitative",
"field": "calc_12",
"title": [
"Running iARR"
]
},
"url": {
"field": "pic"
},
"tooltip": [
{
"type": "temporal",
"field": "dates\\.date\\[date\\]"
},
{
"type": "quantitative",
"field": "new_wins_iarr\\.iarr_sum",
"title": [
"New iARR"
],
"format": "USDCURRENCY_0",
"formatType": "omniNumberFormat"
},
{
"type": "quantitative",
"field": "new_churn\\.churned_iarr",
"title": [
"Churned iARR"
],
"format": "USDCURRENCY_0",
"formatType": "omniNumberFormat"
},
{
"type": "quantitative",
"field": "calc_9",
"title": [
"iARR Adj"
],
"format": "USDCURRENCY",
"formatType": "omniNumberFormat"
},
{
"type": "quantitative",
"field": "calc_8",
"title": [
"Churn Adj"
]
},
{
"type": "quantitative",
"field": "calc_7",
"title": [
"Running iARR"
],
"format": "USDCURRENCY_0",
"formatType": "omniNumberFormat"
},
{
"type": "nominal",
"field": "employee_pics\\.name",
"title": [
"Name"
]
},
{
"type": "nominal",
"field": "pic",
"title": [
"Photo URL"
]
}
]
},
"transform": [
{
"as": "pic",
"calculate": "datum['calc_11']"
}
]
}
],
"width": "1200",
"height": "600"
},
{
"mark": "line",
"width": 1200,
"height": 60,
"params": [
{
"name": "brush",
"select": {
"type": "interval",
"encodings": [
"x"
]
}
}
],
"encoding": {
"x": {
"type": "temporal",
"field": "dates\\.date\\[date\\]",
"title": null
},
"y": {
"axis": {
"grid": false,
"tickCount": 3
},
"type": "quantitative",
"field": "calc_7",
"title": null
},
"opacity": {
"condition": {
"test": {
"not": {
"param": "brush"
}
},
"value": 0.5
}
}
}
}
]
}
```
Happy building!
---
### Author:  [@Elliot](https://community.omni.co/u/Elliot)
#### Post date: [May 14, 2025, 2:46pm UTC](https://community.omni.co/t/fun-company-progress-chart-with-zooming-panning/321/2 "2025-05-14T14:46:51Z")
This is awesome, Colin. Really fun idea. I may try to make something like this on our end.