We often get questions from our customers to see step-by-step building using the built-in visualization power of Omni, especially when customers see the awesome demo dashboards that the Sales Engineering team has built. If that’s you - keep reading!
In this post, we will walk through how to build our internal NBA Stats Demo Dashboard which will show you how to:
- Convert image links into images
- Easily add row banding
- Show and hide fields from a query in the visualization layer
- Column width resizing and justification
- Moving and resizing tiles on a dashboard
- Adding fully customizable markdown tiles directly into a dashboard
We’ll end up with a dashboard that looks like this:
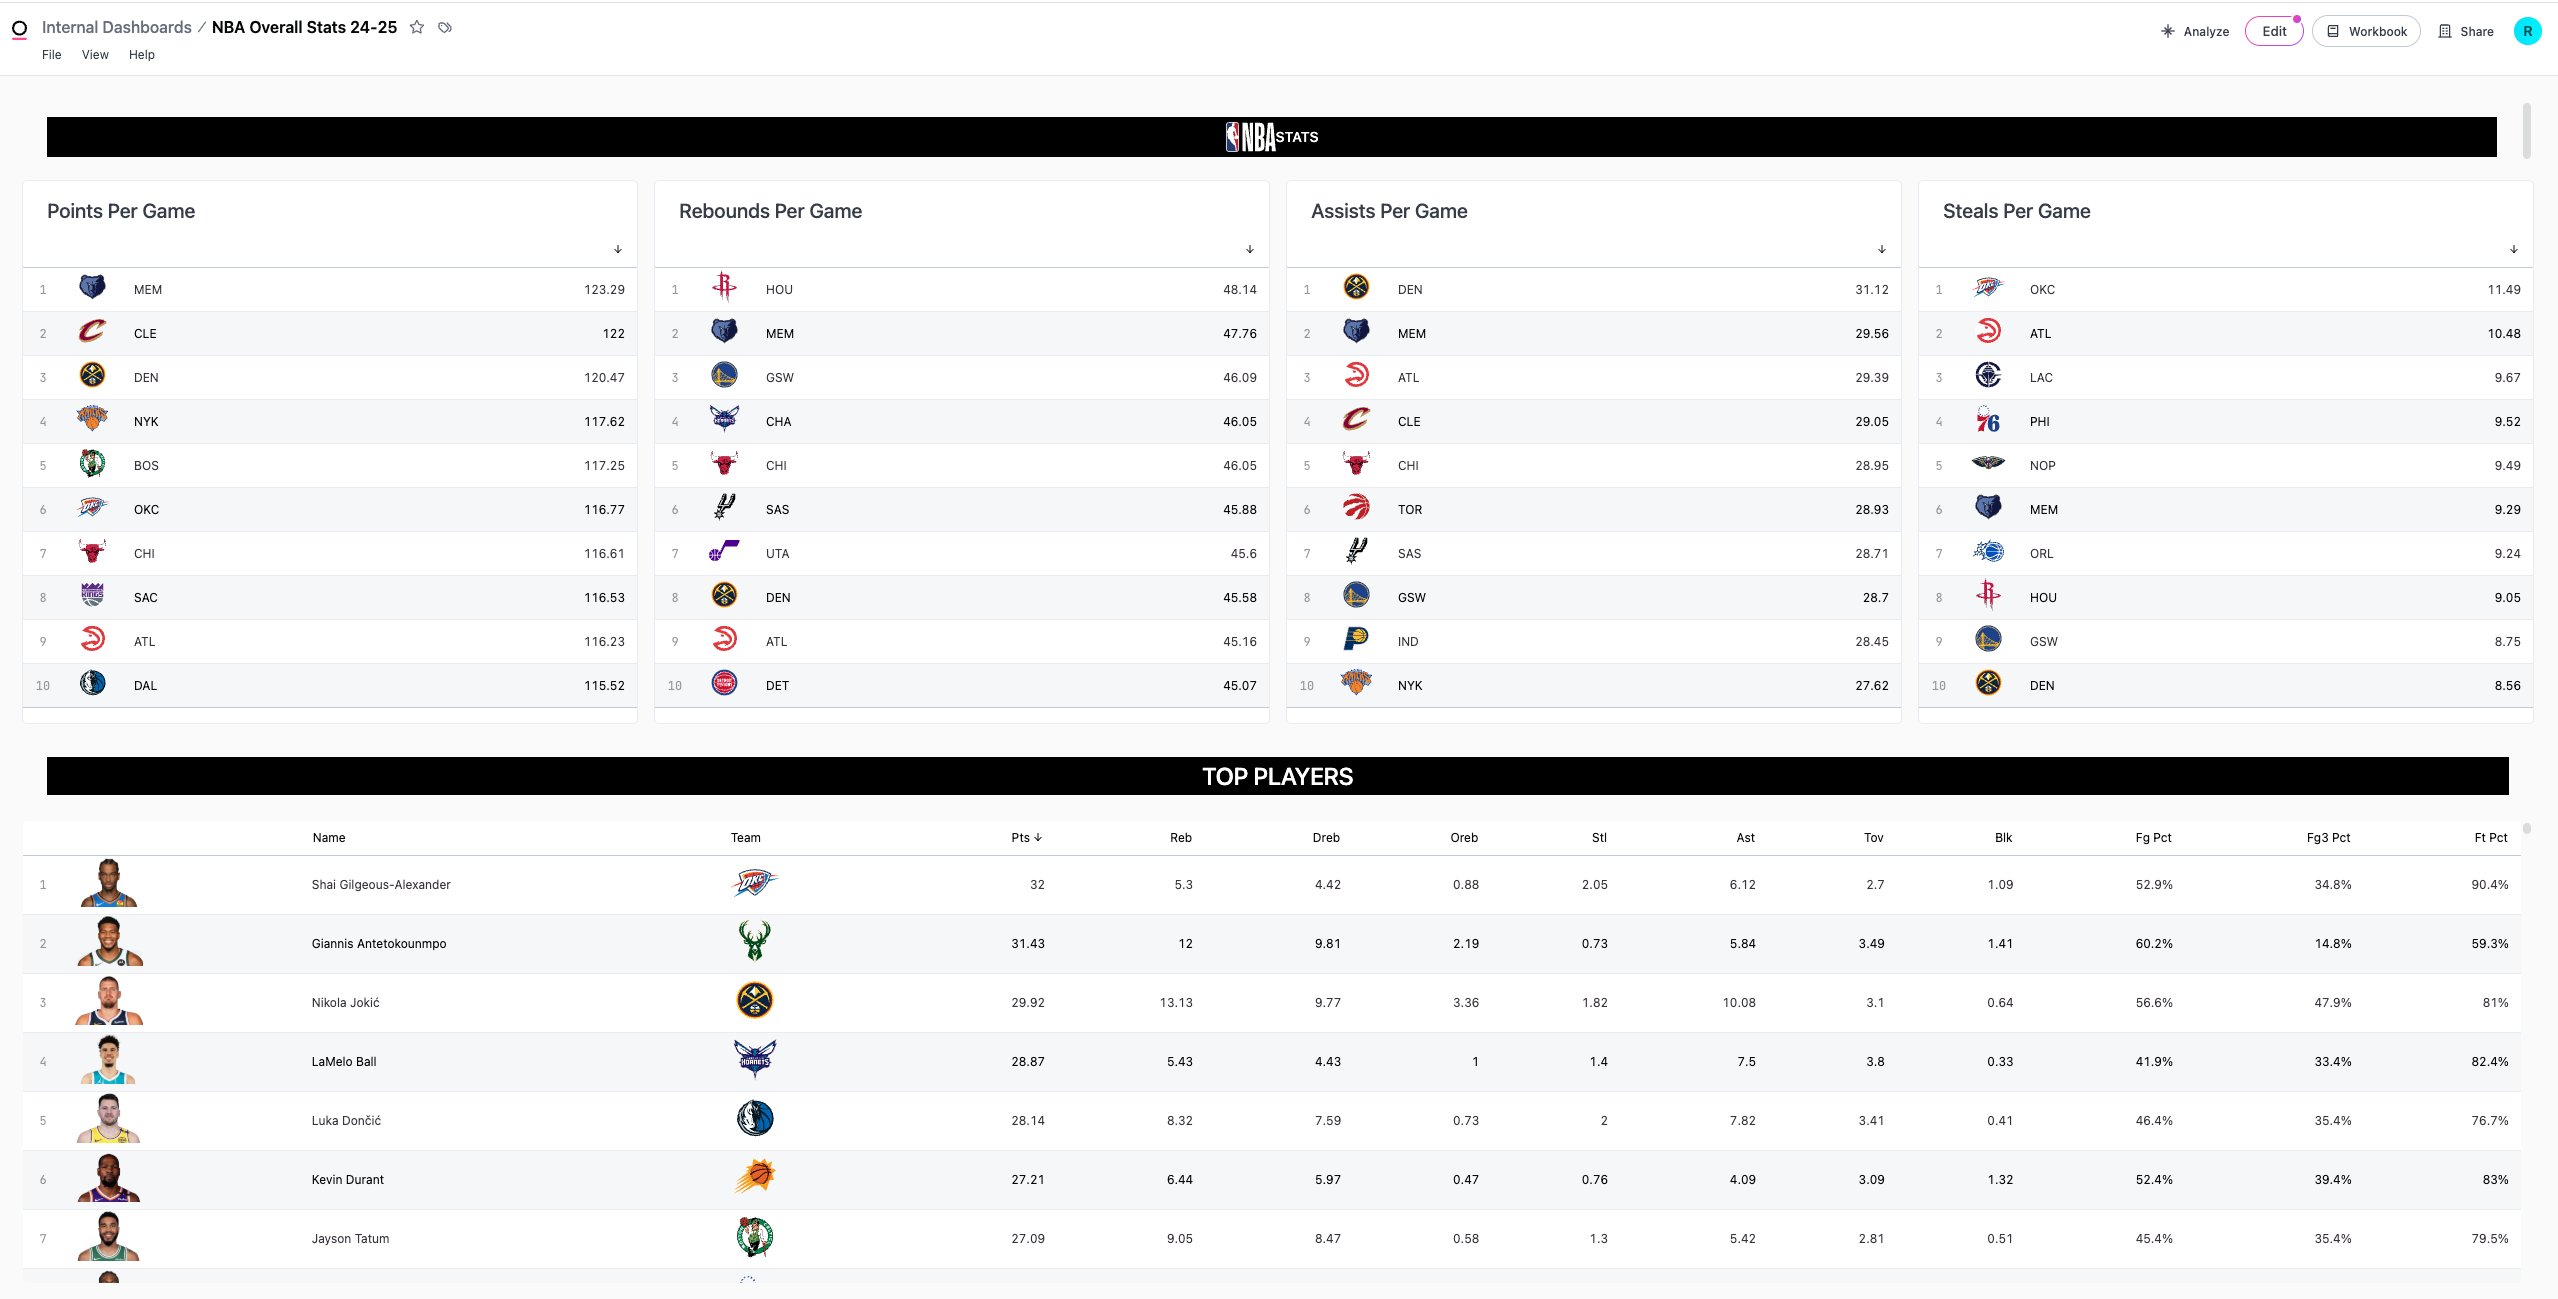
Let’s dive in to the full video walkthrough!