Business Question
For cohort analysis, people often ask about their business is “do longer tenured customers make a larger contribution to sales?”
We can group each user by their first order year and breakdown sales each year this way.
Method 1: Using Level of Detail (LOD) Fields
To calculate the first order date per customer we’ll calculate the minimum Order Date per User ID . We’ll use a Level of Detail (LOD) expression in Omni to calculate the minimum Order Date over Fixed dimensions of User ID.
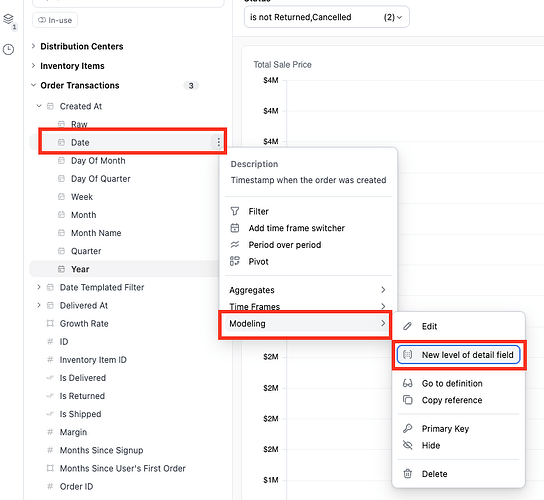
- To calculate a level of detail field through the workbook, go the the Order
Created Atdimension →three dots→Modeling→New level of detail field. - This will open the UI dialog on the left hand side of the field picker.
In the model this will be represented in YAML as. We can have as many timeframes as we like which get auto-generated when selected through the workbook.
  created_at_date__level_of_detail:
    sql: ${omni_dbt_ecomm__order_items.created_at[date]}
    label: Users First Order Date
    description: Timestamp when the order was created
    group_label: Users First Order
    timeframes: [ raw, date, week, month, fiscal_quarter, fiscal_year, year ]
    group_by:
      aggregate_type: min # Gets the earliest date per user
      fixed: [ omni_dbt_ecomm__users.id ] # Groups by individual users
-
This new dimension will show the user’s first purchase date on every row of the orders table when selected.
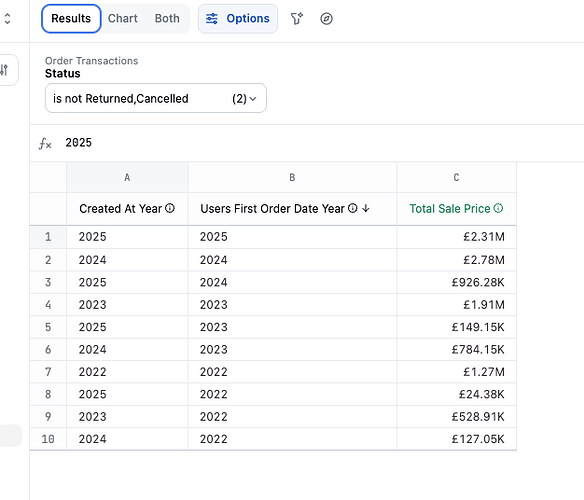
By selecting the User’s Created At Year and the new dimensions
Users First Order Datefor the Year Timeframe, we can see the sales split across each year by cohort. -
Visualizing this as a stacked bar chart and a stacked 100% bar chart to show the growth of sales overtime along the the weightings of the cohorts over time.
Method 2: Query View Approach
Another pattern we could have used here, if we didn’t want to use LOD functions. We could have created a query view grouped by user_id, min( order date). Omni would created a relationship with this table back to the Orders table and it can be used in analyses and added to topics.


