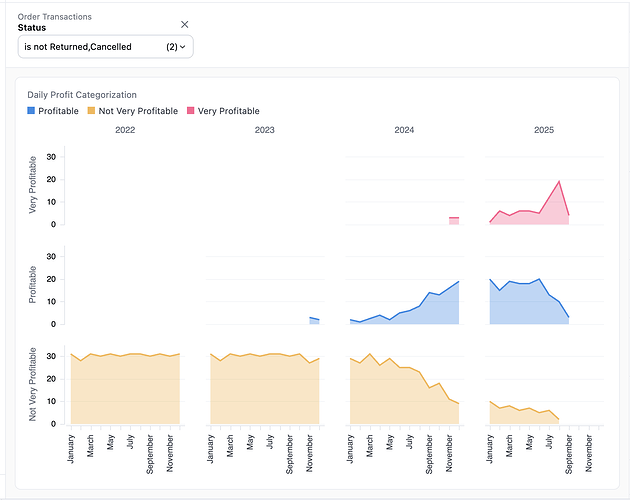
Business performance analysis typically focuses heavily on sales metrics. This analysis typically examines performance across different periods, geographies, segmentations, and compares leaders and laggards in those categories. But what if we want to track how many days were profitable each month? Or going further, how many days fell into different profit categorizations: Not Very Profitable, Profitable and Very Profitable where we decide these thresholds. We want an output like this:
This helps us understand seasonal effects in greater detail and roll up trends above the order level by comparing how many days fall into this category per month for each year.
Approach - Use Level of Detail (LOD) fields
Level of detail fields allow us to compute calculations over dimensions that aren’t actually in the visualization or resulting data. Here’s a step-by-step guide to build this output:
- First, to work out how many days fall within three daily profit categorizations:
Not Very Profitable,ProfitableandVery Profitable, we need to create a dimension that calculates daily profit totals. Starting with theProfitdimension per order, we’ll calculate the daily profit level of detail by getting the sum of profit fixed for each sales day.
In the model this looks like
# dimension
  profit_level_of_detail:
    sql: ${omni_dbt_ecomm__order_items.profit}
    label: Profit level of detail
    group_by:
      aggregate_type: sum
      fixed: [ "omni_dbt_ecomm__order_items.created_at[date]" ]
- Now that the
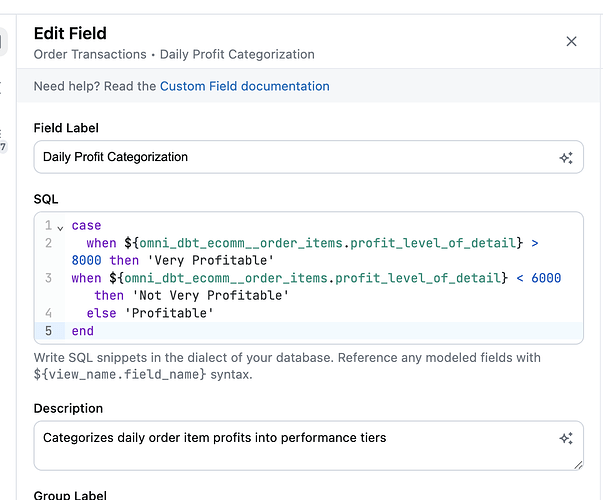
Profit level of detailhas been dimensionalized, we can categorize the daily profits using a case statement to create bins just like a dimension. This is something we can’t do with measures in this way. Here we’ll set three regions, less than $6000, between $6000-$8000 and above $8000.
In the model this looks like
# dimension
  daily_profit_categorization:
    sql: |-
      case
        when ${omni_dbt_ecomm__order_items.profit_level_of_detail} > 8000 then 'Very Profitable'
      when ${omni_dbt_ecomm__order_items.profit_level_of_detail} < 6000 then 'Not Very Profitable'
      else 'Profitable' end
    label: Daily Profit Categorization
-
We can visualize this data now to count the number of days per month for each year in each
Daily profit categorization.- Bring
Created At[Month Name]to the x-axis - Put
Number of Dayson the y-axis (defined asCOUNT(DISTINCT ${omni_dbt_ecomm__order_items.created_at[date]}) - Put
Created At[Year]on the Columns Option of Small Multiples - Put
Daily Profit Categorizationon the Rows Option of Small Multiples - Put
Daily Profit Categorizationon Colors
- Bring
The result will look like the below screenshot, highlighting the seasonality of profitability categorizations in the sales data.


